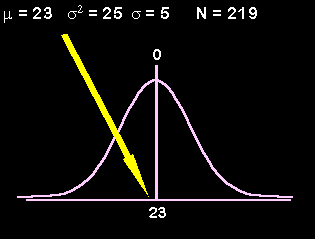
First, we draw a normal curve. We draw a vertical line down the middle. Below that line, we put the mean. Above that line, we put a zero.

Second, we figure out which side of the mean our two scores would fall. We draw a vertical line above each.
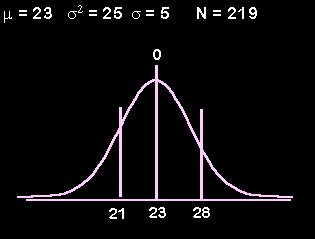
We then shade the area that would be the solution to our problem. In this case we want the area between 21 and 28.
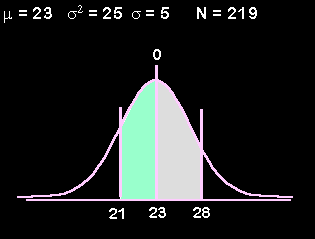
Notice that the line in the middle has a numbers both above it (0) and below it. It is fully dressed. However, the two other lines only have numbers below them (21 & 28) but none above them. We want those lines to be fully dressed. The numbers below the curve are raw scores. The numbers that go above the curve are test statistics (z-scores in this case). So, the two missing numbers will both be z-scores.
One thing we know is that z-scores to the left of the mean are negative and those to the right are positive. We also know two formulas that involve z scores and raw scores. The z-score formula involving raw scores is ![]() or, in words, the z score is equal to the raw score minus the mean, this difference is then divided by the standard deviation. The raw score formula involving z scores is
or, in words, the z score is equal to the raw score minus the mean, this difference is then divided by the standard deviation. The raw score formula involving z scores is ![]() or in words, the raw score is equal to the z times the standard deviation, this product is then added to the mean.
or in words, the raw score is equal to the z times the standard deviation, this product is then added to the mean.
|
Side note: We also have formulas involving z scores and sample means. The z-score formula involving sample means is |
We will use the z-score formula involving raw scores to fully dress our two lines.
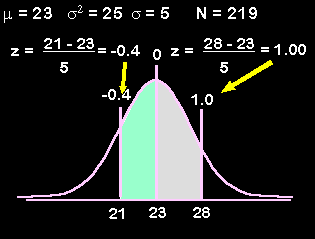
Next, we just go to our z table (pages 401 - 403) to find the area between the mean and z (column c). We do this for each of our two z scores. We add these percentages to our picture. (Percentages and proportions are written inside the curve.)
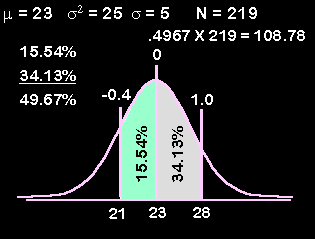
As we can see in our picture, we need to add these two percentages to obtain the total shaded area (15.54% + 34.13% = 49.67%). Once we have the percentage, we convert it to a proportion by moving our decimal point two places to the left (49.67% = .4967). We multiply this proportion by the number of patients, .4967 X 219 = 108.78. We conclude that we would expect about 109 patients to have Idation levels between 21 and 28.