|
Note: We are assuming that you have already entered all the data and have not cleared your calculator. If this assumption is not correct, please go the answer to #11 and enter the data. |
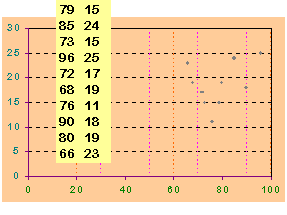
Drawing the scatter plot is easy, we just need to remember that we want both the x and the y axis to start at 0. We then add a dot for every pair of coordinates.

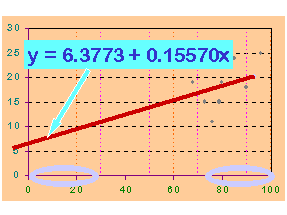
Adding the regression line is a little bit more difficult. We will pick two x values and find their y values. One x value should be near the origin and the other should be from the high end of the x axis. We then add these two points, connect them with a line and we are done. In this case, we might pick 10 and 90 as our two x values. We press [1] [0] [SHIFT] [–] and get a y value of 7.9. We put a dot at (10, 7.9) on our graph. We then press [9] [0] [SHIFT] [–] and get a y value of 20.4. We put a dot at (90, 20.4) on our graph. We connect these two dots with a line and that serves as our regression line.

If we have done this correctly, our regression line should go through the intercept of 6.3773.