Answers to Problems 1 through 4
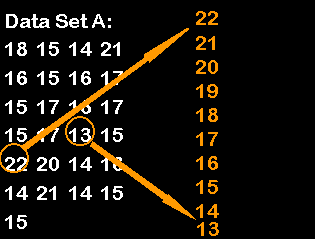
Before working any of these four problems, it is best to create a frequency distribution with percentiles. The first step is to identify the highest and the lowest values in our data set. Then we create a column of numbers going from the highest value to the lowest value, listing each possible value in-between.

Then we place tally marks as follows. Our first number is 18, so we put a tally mark next to 18. Our second number is 16, so we put a tally mark next to 16, and so forth. When our tally marks are done, they should look like this.
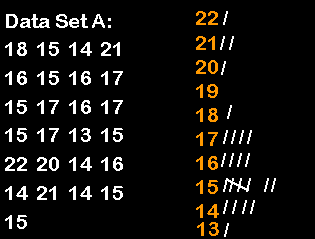
Now, just count the tally marks and write down the number:
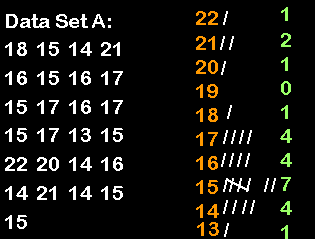
We calculate the cumulative frequency by starting at the lowest value. For each value, we add the frequency of that value to the frequency of all lower values. For example, the value of 17 has a cumulative frequency of 4 + 4 + 7 + 4 +1 = 20 or 4 + 16 = 20.
|
Score |
Freq. |
Calculation |
Cum. Freq |
|
22 |
1 |
24 + 1 |
25 |
|
21 |
2 |
22 + 2 |
24 |
|
20 |
1 |
21 + 1 |
22 |
|
19 |
0 |
21 + 0 |
21 |
|
18 |
1 |
20 + 1 |
21 |
|
17 |
4 |
4 + 16 |
20 |
|
16 |
4 |
12 + 4 |
16 |
|
15 |
7 |
5 + 7 |
12 |
|
14 |
4 |
4 + 1 |
5 |
|
13 |
1 |
0 + 1 |
1 |
We divide each cumulative frequency by the total frequency, which in this case is 25. This gives us the relative cumulative frequency.
|
Score |
Freq. |
Cum. Freq |
Rel. Cum. Freq. |
|
22 |
1 |
25 |
25/25 = 1.00 |
|
21 |
2 |
24 |
24/25 = .96 |
|
20 |
1 |
22 |
22/25 = .88 |
|
19 |
0 |
21 |
21/25 = .84 |
|
18 |
1 |
21 |
21/25 = .84 |
|
17 |
4 |
20 |
20/25 = .80 |
|
16 |
4 |
16 |
16/25 = .64 |
|
15 |
7 |
12 |
12/25 = .48 |
|
14 |
4 |
5 |
5/25 = .20 |
|
13 |
1 |
1 |
1/25 = .04 |
We multiply the relative cumulative frequency by 100 to get the percentiles.
|
Score |
Freq. |
Cum. Freq |
Rel. Cum. Freq. |
Percentile |
|
22 |
1 |
25 |
25/25 = 1.00 |
100 |
|
21 |
2 |
24 |
24/25 = .96 |
96 |
|
20 |
1 |
22 |
22/25 = .88 |
88 |
|
19 |
0 |
21 |
21/25 = .84 |
84 |
|
18 |
1 |
21 |
21/25 = .84 |
84 |
|
17 |
4 |
20 |
20/25 = .80 |
80 |
|
16 |
4 |
16 |
16/25 = .64 |
64 |
|
15 |
7 |
12 |
12/25 = .48 |
48 |
|
14 |
4 |
5 |
5/25 = .20 |
20 |
|
13 |
1 |
1 |
1/25 = .04 |
4 |
The way to read the above is that all percentiles above 0 up to and including 4 are associated with the value of 13. All percentiles above 4 up to and including 20 are associated with the value of 14. All percentiles above 20 up to and including 48 are associated with the value of 15. We can simplify the table by removing the cumulative frequency and relative cumulative frequency columns
|
Score |
Freq. |
Percentile |
|
22 |
1 |
100 |
|
21 |
2 |
96 |
|
20 |
1 |
88 |
|
19 |
0 |
84 |
|
18 |
1 |
84 |
|
17 |
4 |
80 |
|
16 |
4 |
64 |
|
15 |
7 |
48 |
|
14 |
4 |
20 |
|
13 |
1 |
4 |
Now we are in a position to address the individual problems.
1. Draw a box and whiskers plot for Data Set A.
To do this, we first find the following five data points: Lowest, 25th percentile, 50th percentile, 75th percentile, and Highest.
|
Score |
Freq. |
Percentile |
|
22 |
1 |
100 |
|
21 |
2 |
96 |
|
20 |
1 |
88 |
|
19 |
0 |
84 |
|
18 |
1 |
84 |
|
17 |
4 |
80 |
|
16 |
4 |
64 |
|
15 |
7 |
48 |
|
14 |
4 |
20 |
|
13 |
1 |
4 |
In this case:
We then draw a normal curve that extends from before the lowest number to just past the highest number
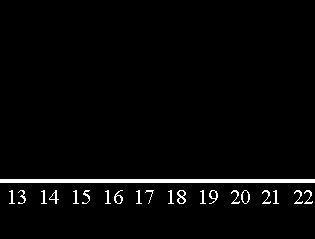
We place dots above the lowest number, the 25th percentile, the 50th percentile, the 75th percentile, and the highest number.
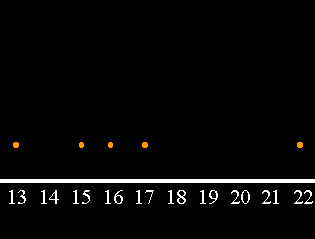
We connect the two left most dots with a line. We also connect the two right most dots with a line.

We draw a box from the 25th percentile dot to the 75th percentile dot.
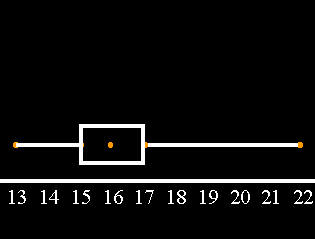
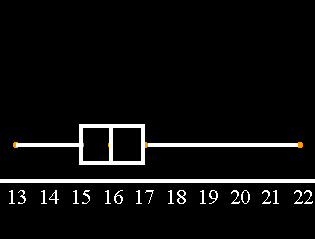
Finally, we draw a vertical line inside the box at the 50th percentile.
2. What is the 60th percentile for the data in Data Set A.
We just look in the table for the lowest percentile at or above 60.
|
Score |
Freq. |
Percentile |
|
22 |
1 |
100 |
|
21 |
2 |
96 |
|
20 |
1 |
88 |
|
19 |
0 |
84 |
|
18 |
1 |
84 |
|
17 |
4 |
80 |
|
16 |
4 |
64 |
|
15 |
7 |
48 |
|
14 |
4 |
20 |
|
13 |
1 |
4 |
In this case, all percentiles above 48 up to 64 belong to the value of 16. Because 60 falls between 48 and 64, the 60th percentile belongs to the value of 16.
3. What is the mode for the data in Data Set A?
The mode is the value with the highest frequency.
|
Score |
Freq. |
Percentile |
|
22 |
1 |
100 |
|
21 |
2 |
96 |
|
20 |
1 |
88 |
|
19 |
0 |
84 |
|
18 |
1 |
84 |
|
17 |
4 |
80 |
|
16 |
4 |
64 |
|
15 |
7 |
48 |
|
14 |
4 |
20 |
|
13 |
1 |
4 |
4. Are the data in Data Set A skewed? If so, are they positively or negatively skewed?
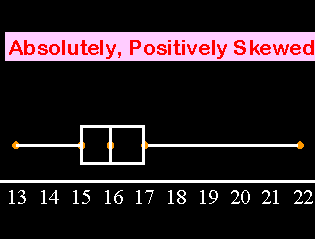
From our box and whiskers plot we can see that the right whisker is much longer than the left whisker. That would indicate that this data is:
However, a much better way of determining the skew is to calculate the mean and median of the data. If the mean is greater than the median, the data is positively skewed. If the mean is less than the median, the data is negatively skewed. We already have the median. The median is the same thing as the 50th percentile, which, in our case, is 16. We will find the mean in problems 5 and 7, so let's revisit this problem after problem #7.