How to Generate
Box-Whisker Plots Using Web Stat
1. Go to
http://www.stat.sc.edu/webstat/
it will take a long time (up to a couple of minutes) to load if you are on a
dial up connection. The last thing to appear will be the orange "Click
here to fire it up!" button. (By the
way, notice the Help link in the same blue rectangular area as the orange button.
WebStat has a wonderful help section.)
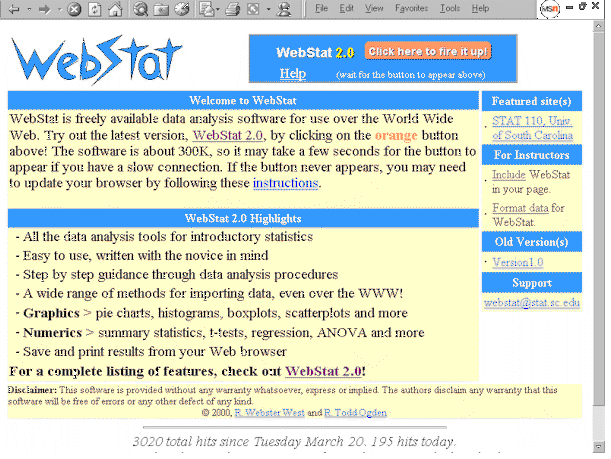
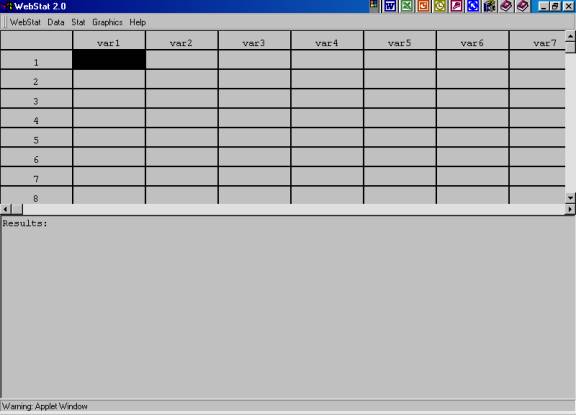
2. Click on the orange "Click here to fire it up!" button and a gray spreadsheet will appear.
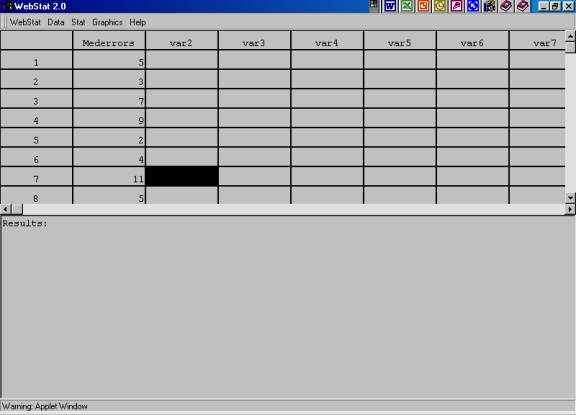
3. This time, we will rename var1 as "Mederrors." Click right on "var1" and press your delete key. Then, type "Mederrors" and then press your enter key. Now we will enter our data (5, 3, 7, 9, 2, 4, 11, 5, 0, 10, 9, 4, 7, 3, 8) into our Mederrors column. We do this by pressing 5 then enter - 3 then enter - 7 then enter, etc. The last number, 8, should end up in row 15.
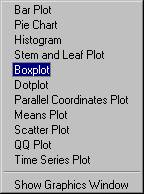
4. After all the data has been entered, put your mouse on "Graphics" then slide it down to "Boxplot."
5. The following dialog box will appear.
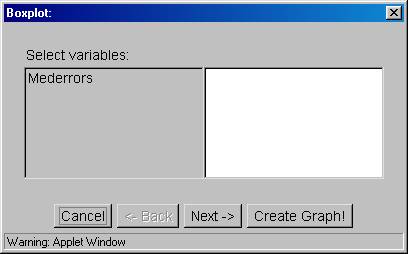
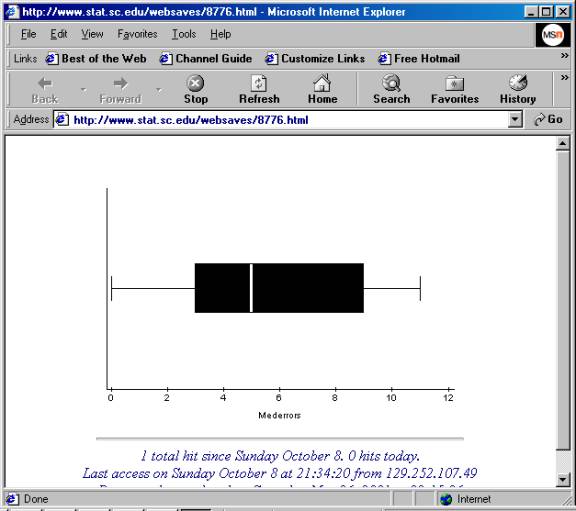
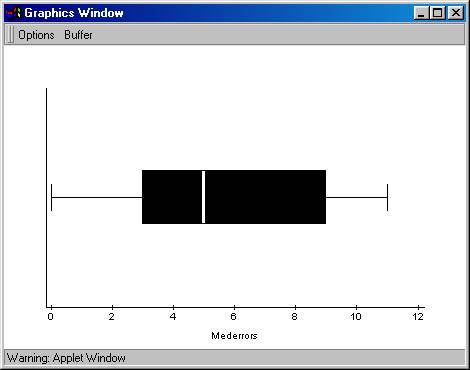
6. Click on "Mederrors" then click on the "Create Graph!" button and the box-whiskers plot will appear.
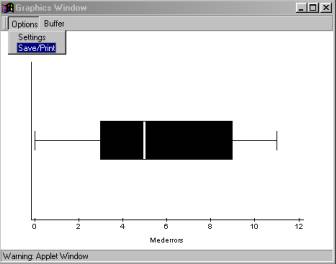
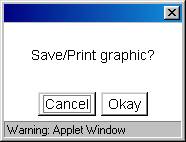
7. There are two ways to save your output. I hold down the "Alt" key as I press the "Print Screen" key. This copies the active window into my computer's clipboard. Then I open my word processing program and do either an Edit/Paste, or a Ctrl-V to paste the picture into my document. Another way to save your output is to Press the "Options" menu then select "Save/Print."
The following menu will appear, you select the "Okay" button.
After a little wait, it should come up as its own web page which you can then save, print, or both save and print.