How to
Do the Calculations for Correlations and Simple Linear Regression
1. Go to http://www.stat.sc.edu/webstat/
it will take a long time (up to a couple of minutes) to load if you are on a
dial up connection. The last thing to appear will be the orange "Click
here to fire it up!" button.
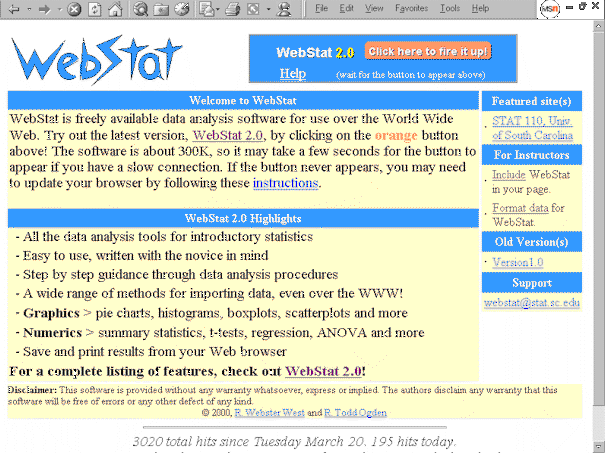
2. Click on the orange "Click here to fire it up!" button and a gray spreadsheet will appear
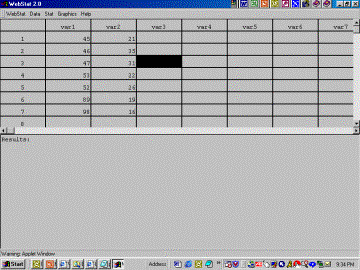
3. Type the data for one variable in the "var 1" column and the data from the other variable in the "var 2" column like above.
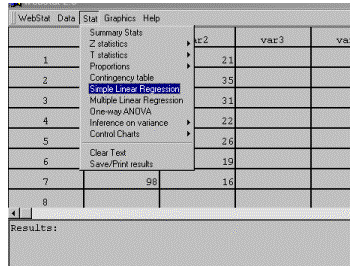
4. After all the data has been entered, put your mouse on "Stat" then slide it down to "Simple Linear Regression."
5. Click on the small down arrow to the right of the box labeled "X Variable" and select the variable that you would plot on the X axis. Then click on the other small down arrow next to the "Y Variable" box and select the variable you would like to appear on the Y axis. For correlations, it does not matter which variable you select to be the X Variable versus the Y Variable. For linear regressions, select the variable for which you want to make predictions as the Y Variable. Select the variable from which you will base your predictions as the X Variable. For example, if you were to predict the height of a child from their age, height would be the Y Variable and age would be the X Variable. After selecting variables you can either press the "Calculate" button or the "Next - >" button.
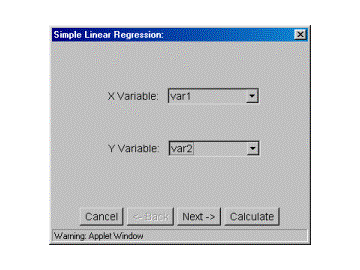
If you click the "Calculate" button, the results will be printed in the lower part of the screen:
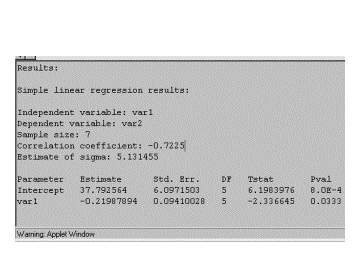
Results:
Simple linear regression results:
Independent variable: var1
Dependent variable: var2
Sample size: 7
Correlation coefficient: -0.7225
Estimate of sigma: 5.131455
|
Parameter |
Estimate |
Std. Err. |
DF |
Tstat |
Pval |
|
Intercept |
37.792564 |
6.0971503 |
5 |
6.1983976 |
8.0E-4 |
|
var1 |
-0.21987894 |
0.09410028 |
5 |
-2.336645 |
0.0333 |
|
|
If, on the other hand, you select the "Next - >" button, the following dialog box will appear:
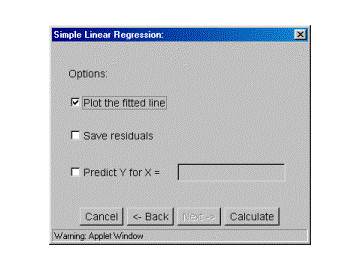
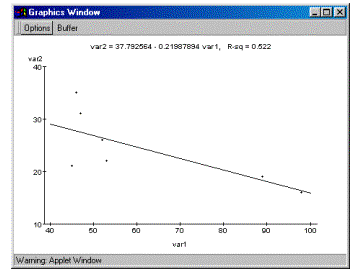
If you select "Plot the fitted line" you will get the calculations above plus a graph showing the points and regression line.
If you select "Save residuals"
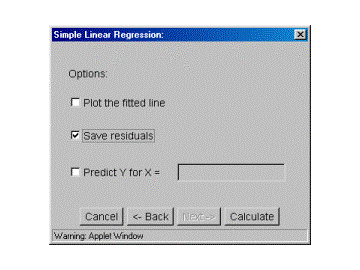
and then press the "Calculate" button, you will get the calculations above plus a new variable will appear containing the residuals (the distance above or below the regression line the particular point is).
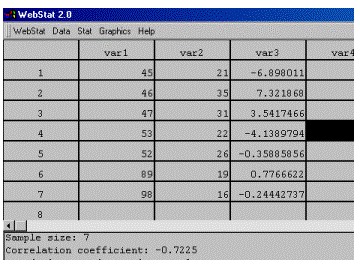
If you select "Predict Y for X =," type a number into the box
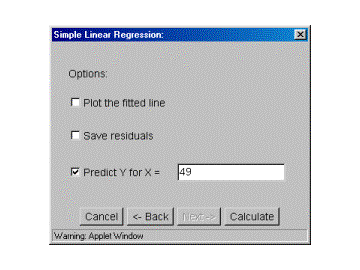
and then press the "Calculate" button, you will get the calculations above plus:
|
X value |
Pred. Y |
s.e.(Pred. y) |
95% C.I. |
95% P.I. |
|
49.0 |
27.018496 |
2.264839 |
(21.196543, 32.84045) |
(12.6, 41.43699) |
You can predict the Y scores of a number of different X values by typing in the numbers with a space or two between the numbers
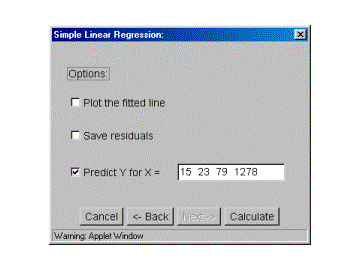
when you press the "Calculate" button, you will get the calculations above plus:
|
X value |
Pred. Y |
s.e.(Pred. y) |
95% C.I. |
95% P.I. |
|
15.0 |
34.49438 |
4.7800984 |
(22.206745, 46.782013) |
(16.467073, 52.521687) |
|
23.0 |
32.735348 |
4.1034317 |
(22.187141, 43.283554) |
(15.845632, 49.625065) |
|
79.0 |
20.422127 |
2.5486612 |
(13.870585, 26.97367) |
(5.6939044, 35.15035) |
|
1278.0 |
-243.21272 |
114.49614 |
(-537.5344, 51.10896) |
(-537.82983, 51.4044) |