How to Calculate
Descriptive Statistics Using Web Stat
1. Go to
http://www.stat.sc.edu/webstat/
it will take a long time (up to a couple of minutes) to load if you are on a
dial up connection. The last thing to appear will be the orange "Click
here to fire it up!" button.
2. Click on the orange "Click here to fire it up!" button and a gray spreadsheet will appear.
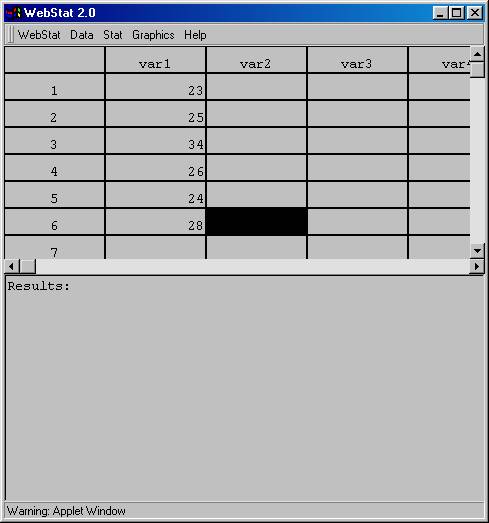
3. Type the data in the "var 1" column like above.
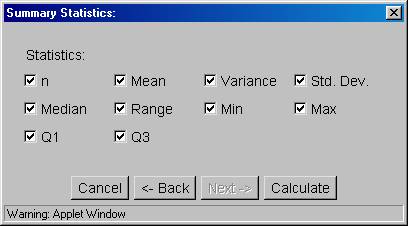
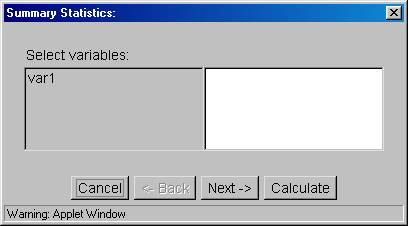
4. After all the data has been entered, put your mouse on "Stat" then slide it down to "Summary Stats."
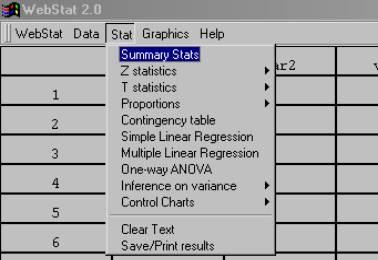
The following dialog box will appear.

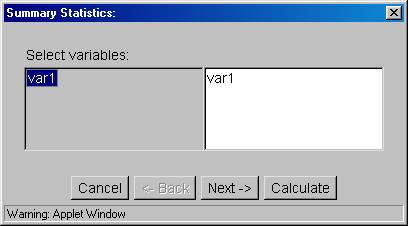
5. Click on "var1" in the gray portion and it will then also appear in the white portion, as shown below.
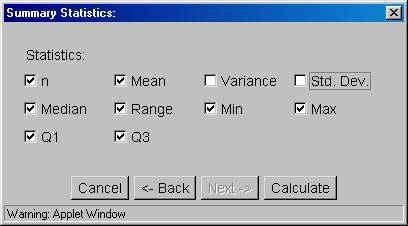
6. If you click the "Next->" button, the following dialog box will appear:
7. Remove the check marks in front of "Variance" and Std. Dev. by clicking on the box in front of them.
8. Press the "Calculate" button and the following results will appear:
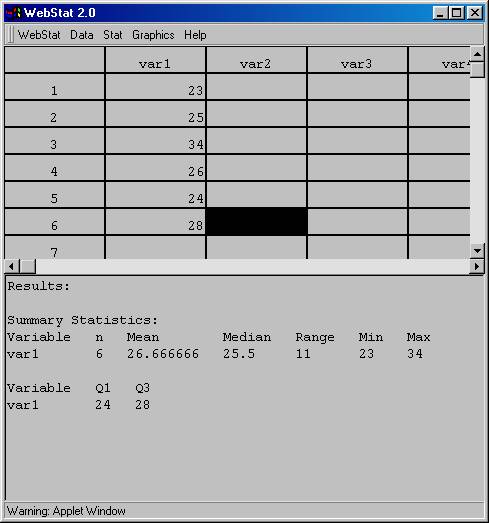
Results:
Summary Statistics:
|
Variable |
n |
Mean |
Median |
Range |
Min |
Max |
|
var1 |
6 |
26.666666 |
25.5 |
11 |
23 |
34 |
.
|
Variable |
Q1 |
Q3 |
|
Var1 |
24 |
28 |
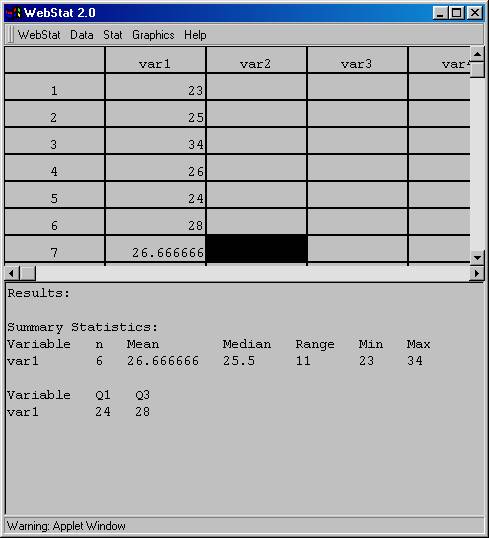
9. Now comes the tricky part. Enter the value
of the mean as an additional value in your variable column:
10. Again, put your mouse on "Stat" then slide it down to "Summary Stats." The following dialog box will appear.
11. Again, click on "var1" in the gray portion and it will then also appear in the white portion, as shown below.

12. Again, click the "Next->" button, the following dialog box will appear:

13. But this time, remove the check marks in front of everything but "Variance" and Std. Dev. by clicking on the box in front of the other statistics.

14. Again, press the "Calculate" button and the following results will appear:
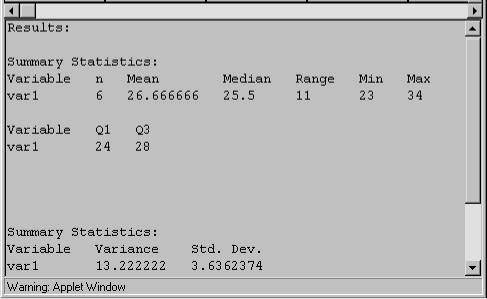
Results:
Summary Statistics:
|
Variable |
n |
Mean |
Median |
Range |
Min |
Max |
|
var1 |
6 |
26.666666 |
25.5 |
11 |
23 |
34 |
.
|
Variable |
Q1 |
Q3 |
|
Var1 |
24 |
28 |
.
Summary Statistics:
|
Variable |
Variance |
Std. Dev. |
|
Var1 |
13.222222 |
3.636237428 |
Here is the logic behind what we did: WebStat
calculates the variance based on (Sum of Squares / n-1). Adding the value of
the mean to our data does not change the Sum of the Squared deviations as a the
value of the mean minus the mean is zero and zero squared is zero. It does
however increase the n by 1, so n + 1 - 1 = n. Therefore we trick WebStat into
using (Sum of Squares / n) which is what we should use when we are calculating
the variance and standard deviation on all the scores in the population.