
How to Do the Calculations for One Sample t-Test Using Web Stat
1. Go to http://www.stat.sc.edu/webstat/
it will take a long time (up to a couple of minutes) to load if you are on a dial up connection. The last thing to appear will be the orange "Click here to fire it up!" button.

2. Click on the orange "Click here to fire it up!" button and a gray spread sheet will appear.
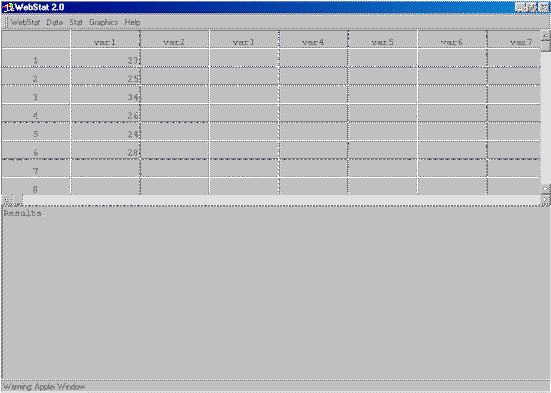
3. Type the data in the "var 1" column like above.
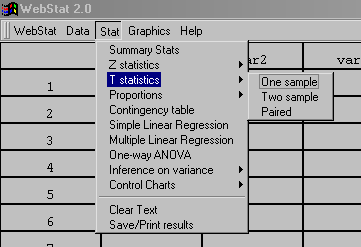
4. After all the data has been entered, but your mouse on "Stat" then slide it down to "T statistic" and then over to "One sample."
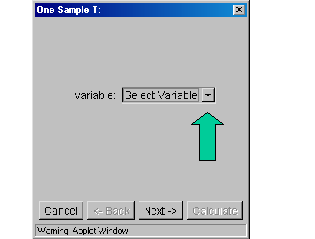
5. Click on the small down arrow as indicated by the green arrow in the diagram below and select var 1.
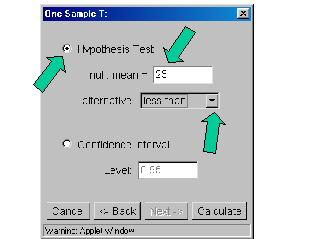
6. Press the "Next" button and the following dialog box will appear. Make sure the "Hypothesis Test" radio button is selected (has a black dot in it). Type the specified mean in the "null: mean =" box. Using the down arrow if necessary, make sure the "alternative" box reads "less than."
7. Press the "Calculate" button. The solution will appear at the bottom of the page:
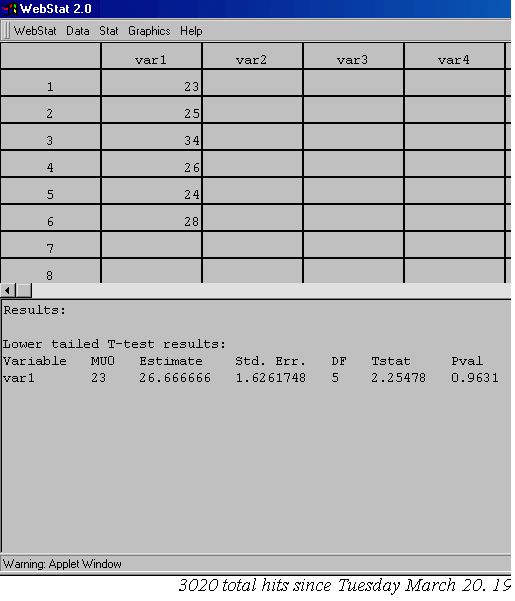
In the above example, the output reads:
Lower tailed T-test results:
Variable MU0 Estimate Std. Err. DF Tstat Pval
var1 23 26.666666 1.6261748 5 2.25478 0.9631
This tells us that our null hypothesized mean is 23, our sample mean is 26.6667, our standard error is 1.6262, our degrees of freedom are 5, our tcomp = 2.2548 and our p value = 0.9631.
Please do not forget to do the 7 steps of hypothesis testing (page 189). Beware that page 189 shows a two-tailed test while you are doing a one-tailed test.