This
tutorial assumes you have already downloaded and installed the academic version
of Statlets. If not, please press the [Links] button, go to Statlets web
site and download and install it on your computer.
How to Do the
Calculations for Correlations and Simple Linear Regression Using Statlet
For this
tutorial, assume you teach in the Nursing department of a highly prestigious University.
The department has developed a system of determining the hardiness of student
applicants. Hardiness scores are rated from 0 to 1, with 1 being the most
hardy. You take a random sample of students who have completed their first year
of nursing education and compare their hardiness score with their grade point
average for the first year. Is there a linear relationship between the
hardiness score and the GPA of nursing students? What is the linear equation
you would use to predict a student's first year GPA from that student's
hardiness score? What GPA would you predict for a student whose hardiness score
is .72?
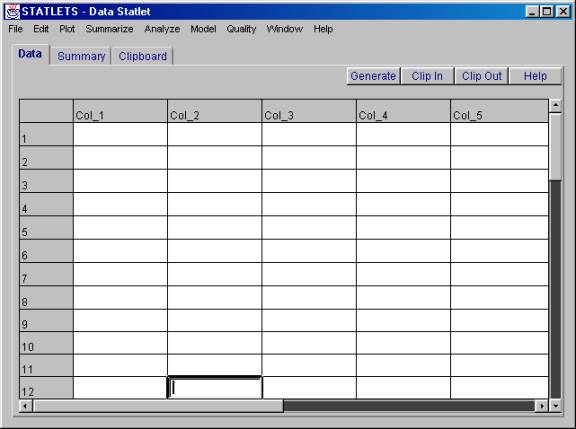
1. When you start Statlets, the following spreadsheet should appear. If not, click on the "File" pull down window and select "New."
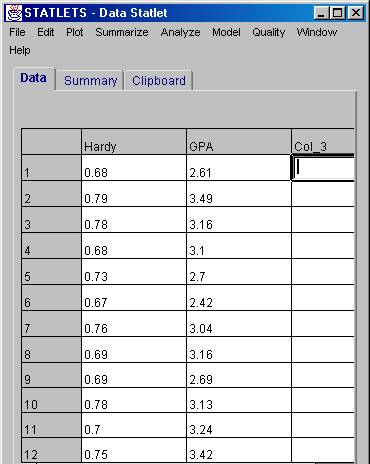
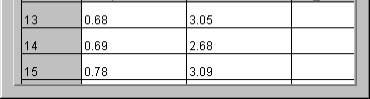
2. Name "Col_1" "Hardy" and enter the following data in that column:
Hardy
.68
.79
.78
.68
.73
.67
.76
.69
.69
.78
.70
.75
.68
.69
.78
3. Name "Col_2" "GPA" and enter the following data in that column:
GPA
2.61
3.49
3.16
3.10
2.70
2.42
3.04
3.16
2.69
3.13
3.24
3.42
3.05
2.68
3.09
4. Click on the "Model" menu, slide down to "Regression Analysis" and slip over to "Simple Regression."
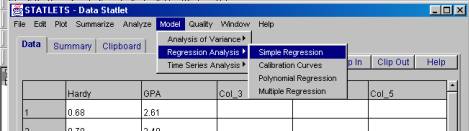
the following dialog box will appear:
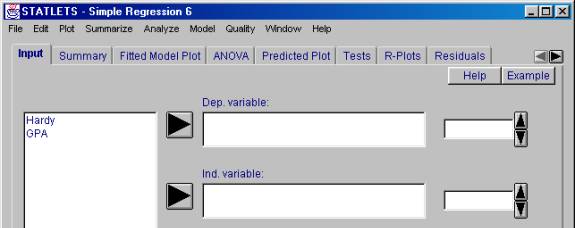
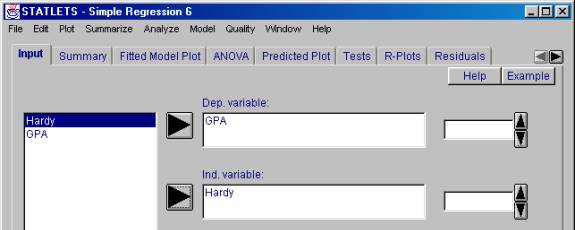
5. Select "GPA" as the dependent variable (the variable we hope to predict) and "Hardy" as the independent variable.
6. Wow!! That was tough. I'm almost in a sweat. But we are done. Now all that is left is reading the results. To see the results, click on the "Summary" tab.
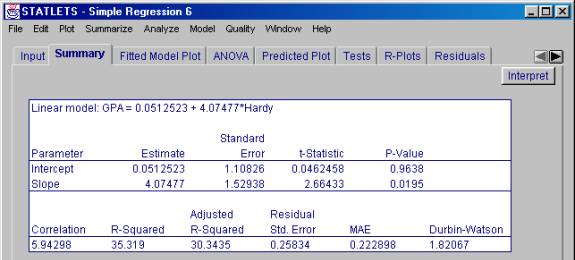
From this output, we would make the following
decision and conclusion:
Decision: Reject H0
Conclusion: At an alpha level of .05, there is
significant direct relationship between hardiness and first year grade point
average, r(13) = .59, p = .0195. The variation in hardiness
accounts for 35.319% of the variance in GPA. The linear equation for predicting
GPA from hardiness is: GPA = 0.0513 + 4.0748*Hardiness.
The only peculiar thing is that the Correlation shown in the table has its decimal moved one to the right. The r of .594298 is reported as 5.94298. It is not worth the time to explain why the author of this program chose to do this, but realize that he did.
7. To predict the GPA for a
student with a hardiness score of .72 select the "Predictions" tab -
you probably need click on the right facing arrowhead ![]() on the right side of the tabs.
on the right side of the tabs.
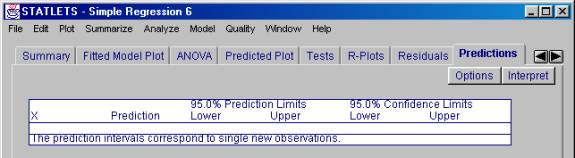
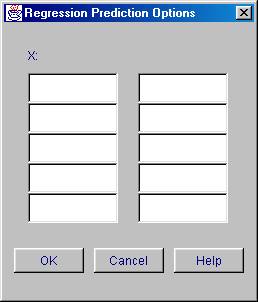
8. Click on the [Options] button.
9. Enter .72 under the X:
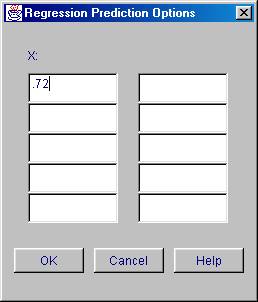
10. Click on the [OK] button.
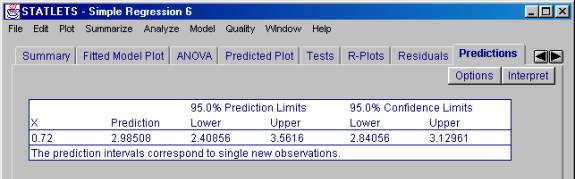
We would predict a student with a hardiness score of .72 to earn a first year GPA of 2.98508 and we are 95% confident that the GPA will be between 2.84056 and 3.12961.
By the way, I just looked up your hardiness
score. Your hardiness score was .99, so I expect you to ace statistics.