This
tutorial assumes you have already downloaded and installed the academic version
of Statlets. If not, please press the [Links] button, go to Statlets web
site and download and install it on your computer.
How to Do the
Calculations for Two Sample t-Tests for Independent Means Using Statlet
For this tutorial, let's test to see if the
weekly weight loss is less for a liquid diet or for a chopstick diet. On the
liquid diet, people can eat anything they want any time they want but first
they have to put it in a special high speed blender that mixes in water and
blends until it is completely liquefied. On the chopstick diet, people can also
eat whatever they want. However, they can only eat with a single chopstick (not
a pair) and can never use their hands or another utensil. Originally, you had
12 subjects in each group but lost two subjects from the chopstick diet. One
put her eye out with the chopstick and quit. The other starved to death.
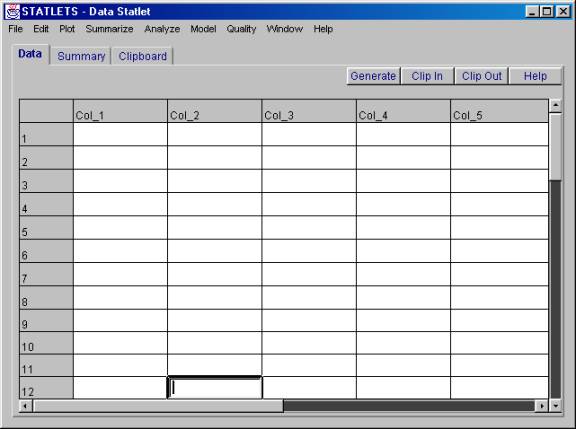
1. When you start Statlets, the following spreadsheet should appear. If not, click on the "File" pull down window and select "New."
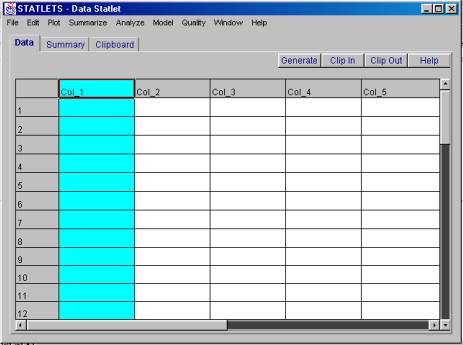
2. Click on "Col_1" and the entire row should become shaded.
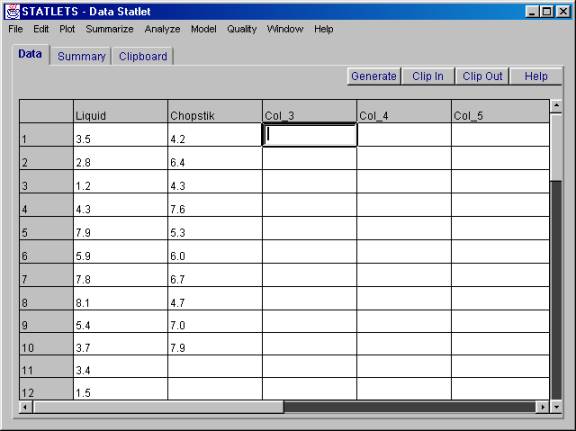
3. Type a new variable name, let's use "Liquid" then press return: Then enter the following numbers, pressing return after each one:
3.5
2.8
1.2
4.3
7.9
5.9
7.8
8.1
5.4
3.7
3.4
1.5
4. Replace "Col_2" with the name "Chopstik" and enter the following data in that column:
4.2
6.4
4.3
7.6
5.3
6.0
6.7
4.7
7.0
7.9
3.7
7.1
5. Click on the "Analyze" menu, slide down to "One Sample" and slip over to "One Variable Analysis."
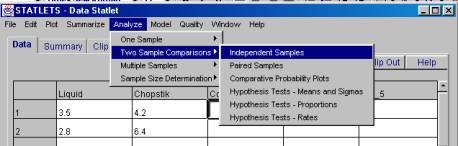
the following dialog box will appear:
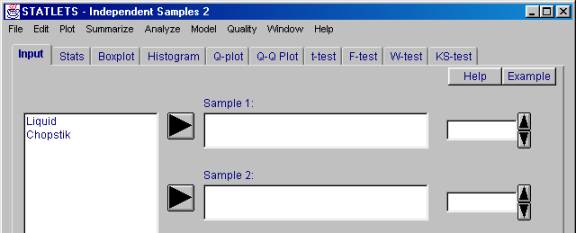
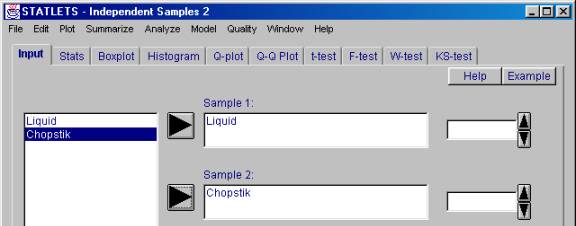
6. Click on "Liquid" then click on arrowhead that is pointing towards "Sample 1:" Then, click on "Chopstik" then click on arrowhead that is pointing towards "Sample 2:"
7. Click on the "t-test" tab and the following should appear.
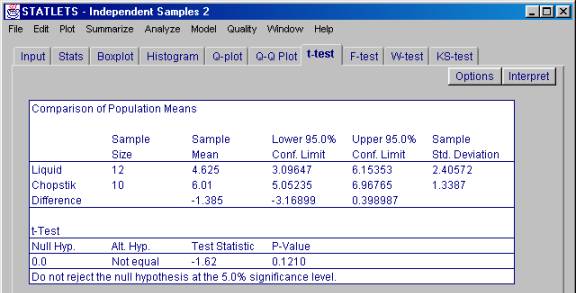
This time, there is no need to use the [Options] button. The default calculations fit our purpose.
From this output, we would make the following
decision and conclusion:
Decision: Fail to reject H0
Conclusion: At an alpha level of .05, there is insufficient evidence to conclude that the mean weekly weight loss differs between the two diets, t(20) = -1.62, p = .1210.
8. Now we want to save this output by either printing it or doing a screen capture.
To print, click on the "File" pull-down menu and select "Print." The following dialog box will appear.
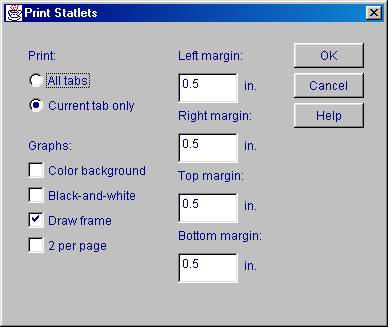
Make sure that the radio button for "Current tab only" is selected as shown above, then press the "OK" button.
Instead of
printing, or in addition to it, you can do a screen capture and then paste the
screen image into a document. To do a screen capture, hold down the
"Alt" key as you press the "Print Screen" key. This puts
the active window (your results) in your computer's clipboard. Now, without
closing Statlet, open your word processor (Word, Works, WordPerfect, etc) and
do a paste (either Edit/Paste or hold down the "Ctrl" key as you
press the "v" key). All the images in this tutorial were done using
this method of screen capturing. Note: if you press the "Print
Screen" key without pressing the "Alt" button, you will capture
the entire screen and not just the active window (which is all we need to
capture) for our purposes.
Just for fun: Click on the other tabs and see what you see. On those tabs, click on the [Interpret] button and read what it has to say.