How to Calculate Summary
Statistics Using Web Stat
1. Go to
http://www.stat.sc.edu/webstat/
it will take a long time (up to a couple of minutes) to load if you are on a
dial up connection. The last thing to appear will be the orange "Click
here to fire it up!" button.
2. Click on the orange "Click here to fire it up!" button and a gray spreadsheet will appear.
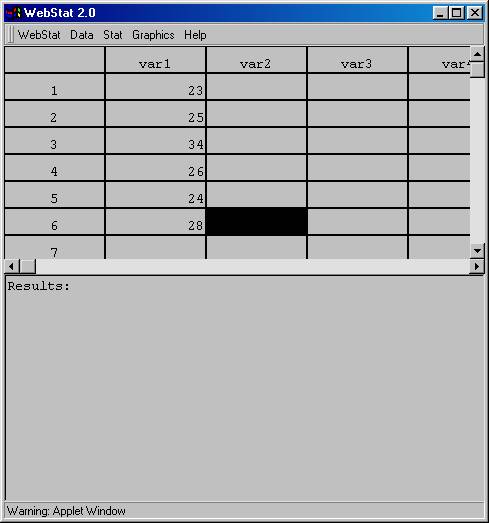
3. Type the data in the "var 1" column like above.
4. After
all the data has been entered, put your mouse on "Stat" then slide it
down to "Summary Stats."
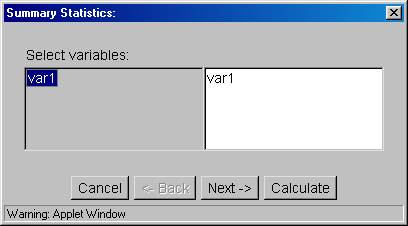
The following menu will appear.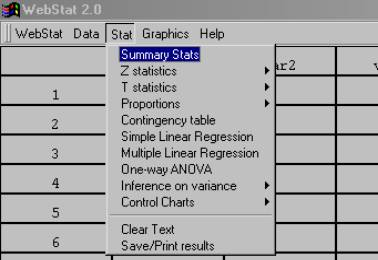
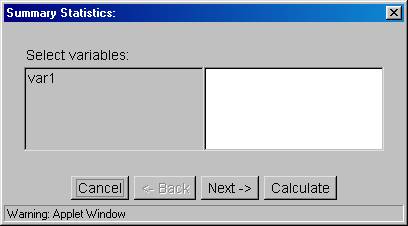
5. Click on "var1" in the gray portion and it will then also appear in the white portion, as shown below.
6. If you click the "Calculate" button, the following results will appear:
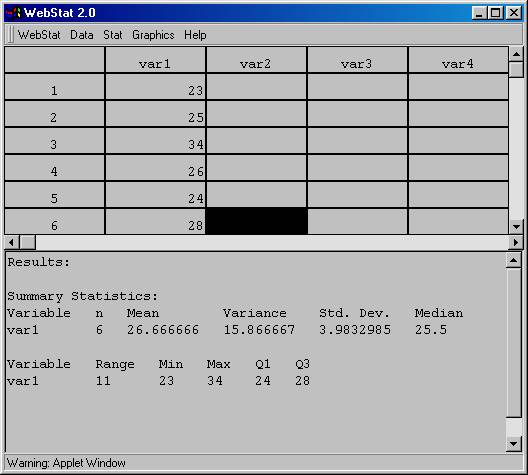
Results:
Summary Statistics:
|
Variable |
n |
Mean |
Variance |
Std. Dev. |
Median |
|
var1 |
6 |
26.666666 |
15.866667 |
3.9832985 |
25.5 |
.
|
Variable |
Range |
Min |
Max |
Q1 |
Q3 |
|
Var1 |
11 |
23 |
34 |
24 |
28 |
Note: The variance and standard deviation are
based on Sum of Squares / n - 1.